Debugging POS UI Extensions
APIs and components will report if they receive parameters of an unexpected type. For further debugging, you can use console.log to print any additional information in the console.
If an API receives an incorrect parameter, it won't attempt to perform the action and it will throw an error instead. This error can be viewed either by implementing a try/catch block or by using the Chrome console.
If a component is given an incorrect parameter, the extension will be replaced with a non-descriptive user interface that indicates an issue has occurred. In case the extension is running locally, the developer will also see the exact error displayed as a toast message.
In the future we plan to modify this behavior to display the error in the Chrome console instead, aligning with the API approach.
Using Chrome console
Anchor link to section titled "Using Chrome console"This section covers how to view POS UI Extension logs and errors.
Requirements
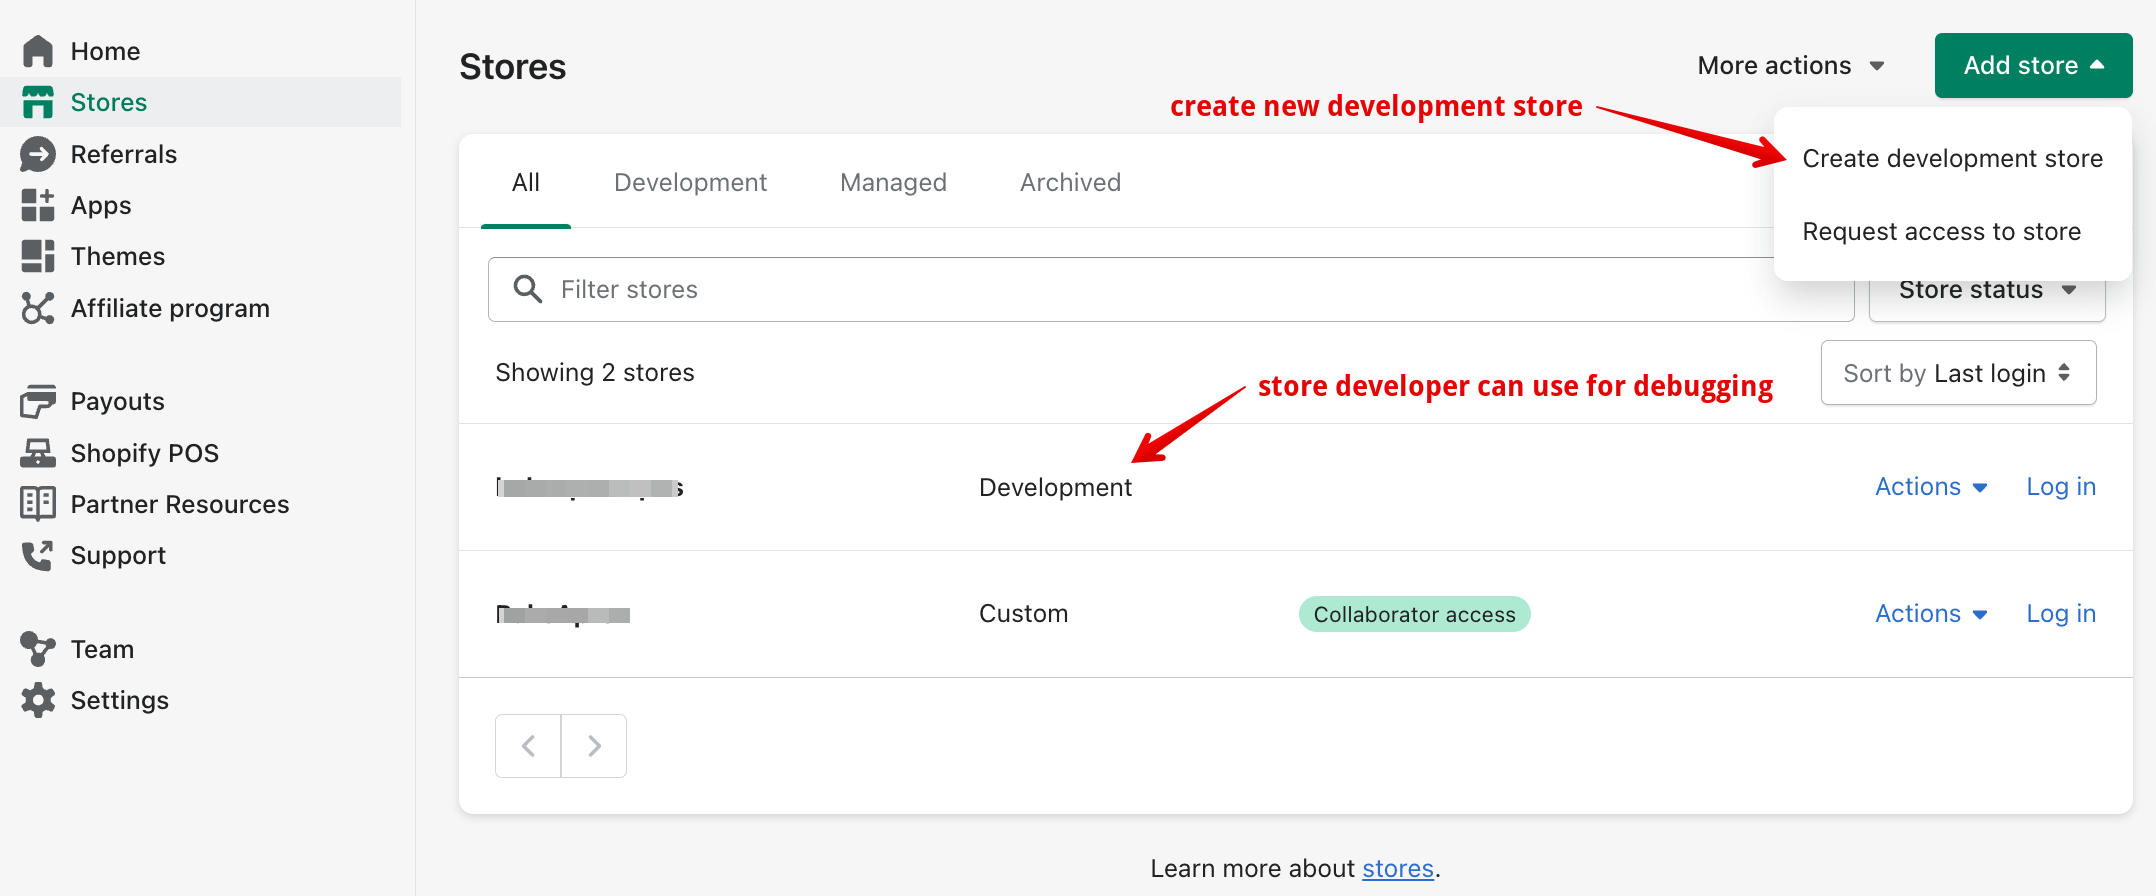
Anchor link to section titled "Requirements"- The extension needs to be running on a development store in the POS app. Debugging is only available on development stores. You can create a development store from the Partner Portal, or you can use an existing development store for debugging purposes.
- You've set up an Android Studio emulator, or you have an Android device available with the POS app installed. If you use an Android device, you can follow the Chrome developer documentation to set up a device for debugging purposes.
You can debug your POS UI Extension by following these steps:
- Connect the Android device to your computer or launch the Android emulator.
- Make sure the POS UI Extension is running on the POS app.
- Using Google Chrome, navigate to chrome://inspect.
- The UI Extension WebView should appear on the list as "Shopify UI Extensions Internal"
- Click the inspect button. This should open a DevTools window, where you will be able to interact with the console, and view
console.logstatements in your code along with inspecting the network activity.
The following demo shows the debugging in action leveraging tools such as Console and Network available in Chrome. The example extension code has console.log statements when the SmartGrid tile is pressed to open modal and also to log the remote fetch response.