Troubleshoot webhooks
If your app uses webhooks, monitor for and respond to failed delivery notifications. Shopify retries failed webhook calls up to eight times in a four-hour period, but if failures persist, the subscription is removed.
If your app was created in the Dev Dashboard or using Shopify CLI, you can use the delivery metrics report to troubleshoot delivery failures and view performance data.
This guide shows you how to use the delivery metrics report to track failed deliveries and fix them before they affect app users.
Anchor to Monitor performanceMonitor performance
Your app's Overview page shows delivery counts and response time over the selected time range. For an overview of all monitoring tools in the Dev Dashboard, see Monitoring and logs.
- From your Dev Dashboard, click Apps.
- Click the name of your app.
- In the sidebar, click Overview.
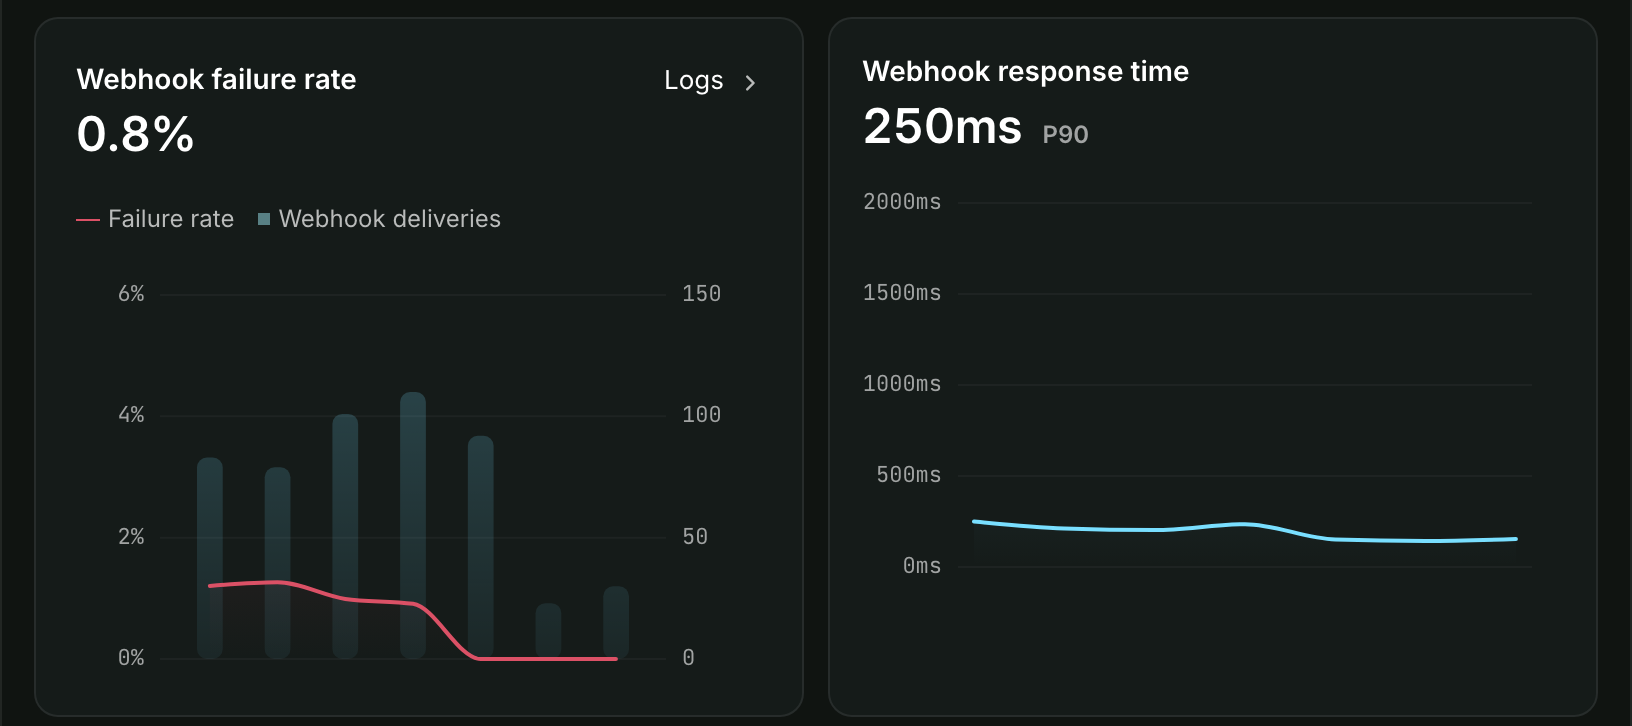
You can manually trigger a webhook to check delivery metrics by updating your dev store. For example, create a product to trigger products/create.
You can manually trigger a webhook to check delivery metrics by updating your dev store. For example, create a product to trigger products/create.
Change the time range for the charts using the dropdown on the Operations card. To filter deliveries by topic, shop, or status, use the Logs view.
From this view you can inspect the following plots:
- Deliveries: Successful deliveries as bars, with the failure rate as a line, over the selected time range.
- Response time: Your app's 90th percentile response time over the selected time range.
The charts report the following metrics:
| Metric | Description |
|---|---|
| Failed delivery rate | The percentage of unsuccessful delivery attempts out of the total number of delivery attempts. |
| Deliveries | Successful delivery attempts across all subscriptions. Failed attempts are counted in the failed delivery rate instead of this series. |
| Response time | The 90th percentile of your app's response time. 90% of responses were equal to or faster than the listed time. |
From the Overview page, you can also view your app's delivery logs and delivery details.
Anchor to View delivery logsView delivery logs
The Logs page shows individual deliveries filterable by topic, status, and destination shop over the past 7 days.
- From your Dev Dashboard, click Apps.
- Click the name of your app.
- In the sidebar, click Logs.
The delivery logs dashboard doesn't provide real-time updates. Data could be delayed up to several minutes.
The delivery logs dashboard doesn't provide real-time updates. Data could be delayed up to several minutes.
Set the time range with the dropdown, then narrow the list in the Filter logs field. Each filter is a dimension and a value, such as Type is Webhook or Topic is products/create, and you can combine several. Refer to Filtering logs.
After clicking on an individual delivery, you can investigate the following:
| Field | Description |
|---|---|
| Response | The response code your app sent when it received the webhook. |
| Topic | The topic the subscription is listening to. |
| Shop | The URL of the Shopify store associated with the delivery. |
| Time | The date and time of the most recent delivery attempt. |
Anchor to Responses and retriesResponses and retries
A 200 series status response is considered successful.
If your app has a high rate of successful responses, then the logs display a sample of successful responses.
If your app doesn't respond with a 200 series status code, the delivery has failed.
Shopify retries failed deliveries up to 8 times.
Anchor to Prioritize fixesPrioritize fixes
Use the response code and retry count to decide which webhooks to fix first. Prioritize webhooks with any of the following:
- Removed response: Removed webhook subscriptions won't receive any deliveries unless you create them again.
- Delivery failed after retries: After 8 failed delivery attempts, Shopify stops attempting delivery. You might need to recover missing data.
- High failure rates on a single webhook: A high rate on one webhook may indicate a handler-specific or payload-specific error.
- High failure rates across all webhooks: If all your webhooks have a high failure rate, your backend may not be responding. Use your monitoring tools to investigate.
Anchor to View delivery detailsView delivery details
When you click a delivery from the Logs page, a panel opens with the following information:
The details panel lists the following information for each delivery:
| Field | Description |
|---|---|
| Topic | The topic the subscription is listening to. |
| URI | The endpoint the delivery was sent to. |
| Subscription method | How the subscription was created, for example App specific. |
| API version | The API version used for the delivery. |
| Subscription ID | The ID of the webhook subscription. |
| Webhook ID | The unique ID of this delivery. |
| Response | The HTTP status code your app returned. |
| Time | The timestamp of the delivery attempt in EDT, UTC, and relative time. |
| Shop | The domain of the store that triggered the delivery. |
| Shop ID | The ID of the store that triggered the delivery. |
| Payload size | The size of the delivery payload. |
| Response time | The time between the delivery request and your app's response. If your app doesn't respond within five seconds, the delivery fails. |
| Delivery attempt | The attempt number for this delivery. |
| Delivery method | The method used to deliver the webhook, for example http. |
| HMAC SHA-256 | The HMAC signature sent with the delivery. Use this to verify the delivery came from Shopify. See Verify deliveries. |
| HTTP headers | The HTTP headers sent with the delivery. |
Anchor to Troubleshoot delivery failuresTroubleshoot delivery failures
Delays caused by webhook failures can affect app users. Each time a delivery fails, the interval before the next retry increases. This can cause your data to become out of sync, especially if you process many events or time-sensitive data.
To identify and resolve failed deliveries, look for the following issues:
| Issue | Description |
|---|---|
| Failed delivery rates over 0.5% | This is a higher-than-average failure rate and might mean your webhook is failing across multiple stores, or has failed multiple times in a row. A high failure rate on one topic might indicate a store-specific or payload-specific error. |
| Removed webhooks | Your app isn't receiving data for subscriptions removed after multiple failed delivery attempts. Fix the issue, then recreate the webhook subscriptions. |
| Response times between four and five seconds | Your app must respond to the webhook within five seconds. To resolve timeout failures, delay processing until after you've sent a response. |
| Same failure rates across all topics | If all your topics have a high failure rate, your backend might not be responding. Use your monitoring tools to investigate. |
Anchor to Manage delaysManage delays
You might experience delays receiving webhooks. If receiving webhooks up to a day late might cause issues in your app, then compare the timestamp of the webhook to the current date and time.
Anchor to Recover from a downtime eventRecover from a downtime event
If your app goes offline for an extended period of time, then you can recover by re-subscribing to your webhook topics (if applicable) and importing the missing data.
You don't need to re-subscribe if your app uses app-specific webhook subscriptions. For shop-specific webhook subscriptions, consult the app's code that initially created the subscriptions. You can add a check that fetches all the existing subscriptions and creates only the ones that you need.
To import the missing data, you can fetch data from the outage period and feed it into your webhook processing code.
Anchor to Next stepsNext steps
- Webhooks reference: Browse supported webhook topics and payload structures.
- Verify deliveries: Verify HMAC signatures and handle duplicate webhook deliveries..