Monitor app performance
Alerts flag what needs your attention, the charts on an app's Overview show how the app is performing, and Logs lists the individual events behind those charts. This page covers what each one shows, how to filter logs, and where to go when something looks wrong.
Anchor to Alert statusesAlert statuses
An app is flagged when something needs your attention, whether that's a failing integration, a platform deprecation, or a change to the app's App Store standing. The same statuses surface in three places:
- The Alerts column of the Apps list.
- The banner on the app's Overview.
- The Portfolio summary on Home.
The wording can differ slightly between them, so match on what the alert is telling you rather than on the exact label.
Statuses carry a severity. Critical means act now, and Warning means act soon. Within a severity, this table follows the order the dashboard itself ranks alerts in. Where a status has a deadline, such as a deprecated API removal date, the alert shows it.
| Status | Severity | What it means |
|---|---|---|
| Delisted | Critical | Your app was removed from its Shopify App Store listing. Resolve the issues and resubmit. |
| Suspended | Critical | Your app was suspended. Review the suspension details before taking any other action. |
| Built for Shopify revoked | Critical | Your app lost its Built for Shopify status. |
| Built for Shopify suspended | Critical | Your app's Built for Shopify status is suspended over admin performance scores. |
| Webhook failures | Critical | Deliveries are failing often enough to put your subscriptions at risk. Refer to Logs. |
| Deprecated offline token (past deadline) | Critical | A non-expiring offline access token has passed its deadline. Refer to Migrate to expiring offline access tokens. |
| Built for Shopify at risk | Warning | Your app's admin performance scores are trending toward losing Built for Shopify status. |
| Function errors | Warning | Function runs are failing. Refer to Logs. |
| Outdated extension API version | Warning | An app extension is pinned to an API version that's fallen out of support. |
| Deprecated API calls | Warning | Your app is still calling APIs that are scheduled for removal. The alert shows how many calls and by when. |
| Deprecated offline token (approaching) | Warning | A non-expiring offline access token is approaching its deadline. |
Stores can be flagged too, with expired collaborator access or a transfer in progress. Those appear alongside app alerts in the Portfolio summary on Home. A transfer in progress is informational: it tracks something already underway and needs nothing from you.
Anchor to MetricsMetrics
An app's Overview carries three cards, all measured by Shopify so you don't have to instrument anything yourself: Operations for app health, Admin performance for how your pages behave inside the merchant admin, and Growth for the business side.
App events aren't charted on any of them. For their volume over time, use the event graph in Logs.
Anchor to OperationsOperations
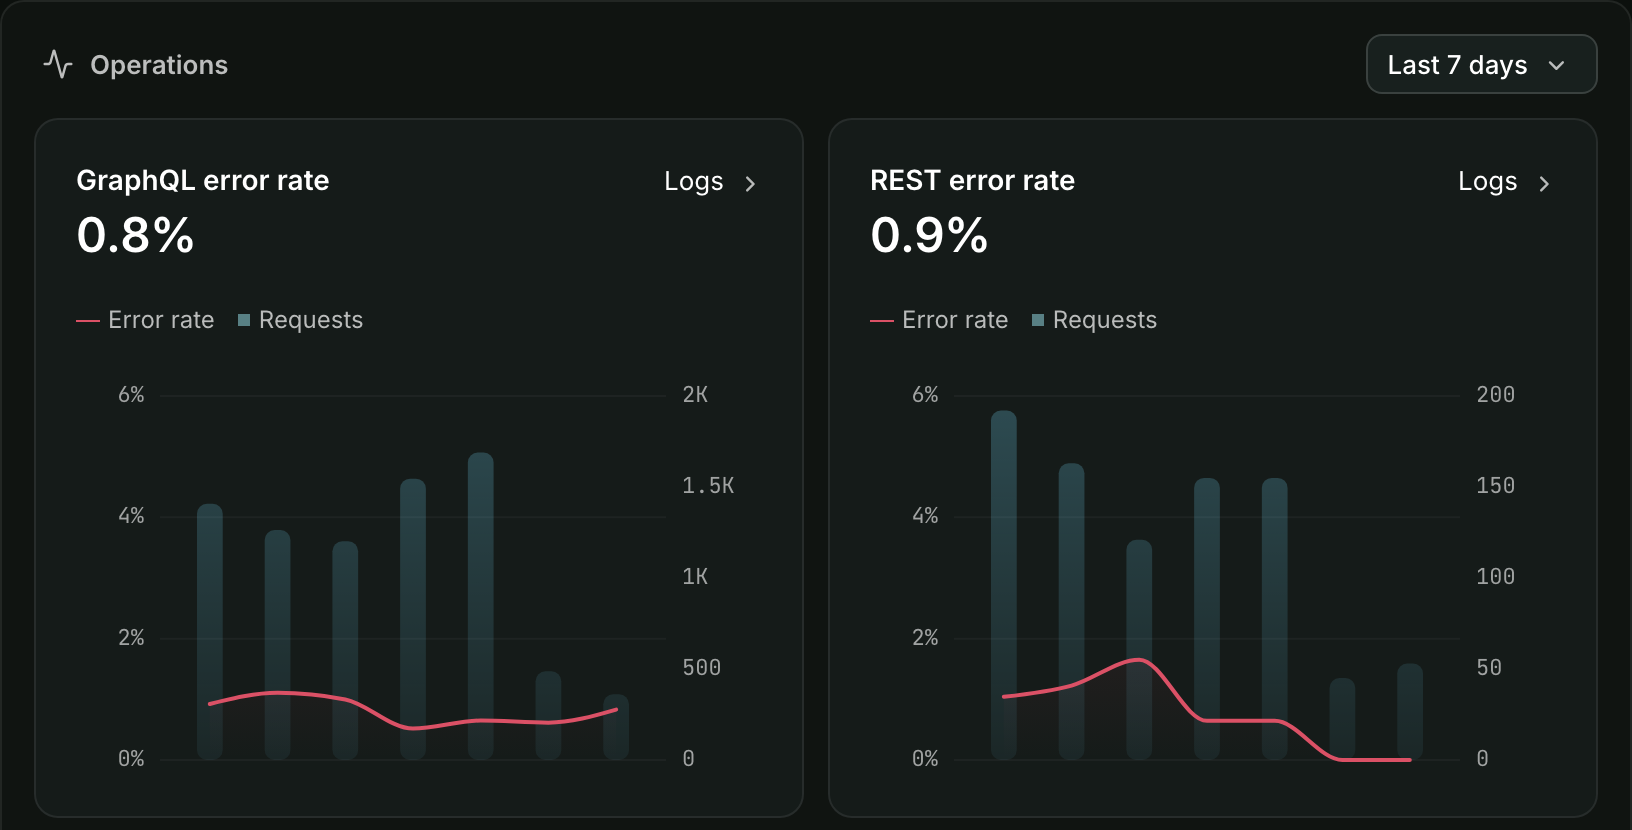
Operations charts your Admin API calls, webhook deliveries, and Function runs. Each rate is plotted against the volume behind it, so you can see whether a 50% error rate covers 4 calls or 40,000.
A high webhook failure rate is flagged High on the chart. That indicator has no volume floor, so a handful of failures on a quiet app can trip it. The Webhook failures alert is a separate, stricter test: more than 0.5% of deliveries failing across at least 500 deliveries in 24 hours. Act on the alert, because once failures persist Shopify removes the subscription and your app stops receiving that topic.
When a rate is climbing, use the chart's Logs link instead of filtering by hand: it opens Logs already narrowed to that event type and to failures only.
Anchor to Admin performanceAdmin performance
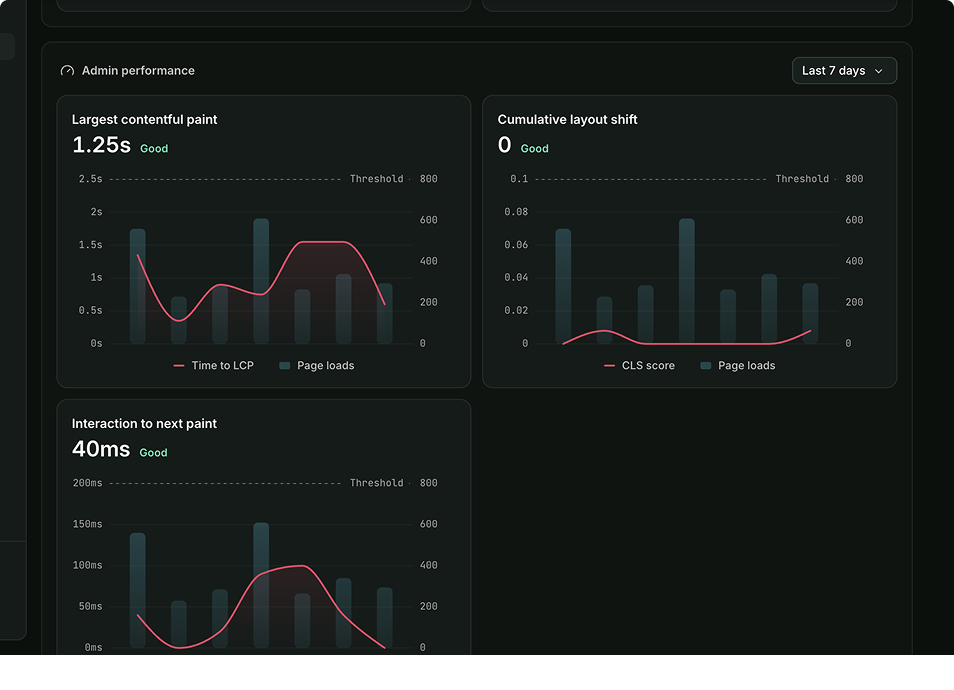
Admin performance scores three Core Web Vitals for your app's admin pages: Largest Contentful Paint, Interaction to Next Paint, and Cumulative Layout Shift. All three are measured in the merchant's browser, not on your server, so a fast backend won't carry a slow interface.
Built for Shopify assesses the same vitals, but on its own 28-day window with a minimum number of measurements, so a rating here isn't its verdict. The card also has its own time range options, so check the range on each before you compare it with the other charts.
Anchor to GrowthGrowth
Growth tracks the business side rather than app health: revenue, plus install and uninstall events. Revenue is charted in whole days, so it leaves out today's partial day, while install and uninstall events include it. You'll only see revenue if your role includes financials.
An app's Overview reports installs in more than one place, and the numbers don't always match:
| Metric | What it counts |
|---|---|
| Install events | Installs that happened inside the range you picked, charted in the Growth card. Nothing is subtracted, and a store that installs again later counts each time. |
| Uninstall events | Uninstalls that happened inside the range you picked, charted in the Growth card. |
| Installs | The net count, shown in the upper right: stores whose installation is still on record, including your own dev stores and stores with no active plan. |
Say your app picked up 12 installs last week and 3 stores removed it. Across that week:
- Install events shows 12.
- Uninstall events shows 3.
- The Installs card sits 9 higher than it did on Monday.
Select the count on the Installs card to open Current installs: a searchable list of those stores, with each one's plan, install date, and contact details.
Anchor to LogsLogs
Logs brings every kind of event your app produces onto one timeline: Admin API requests, webhook deliveries, Function runs, UI extension errors, and your own app events. When a merchant reports a problem, this is where you find out what your app actually did for them.
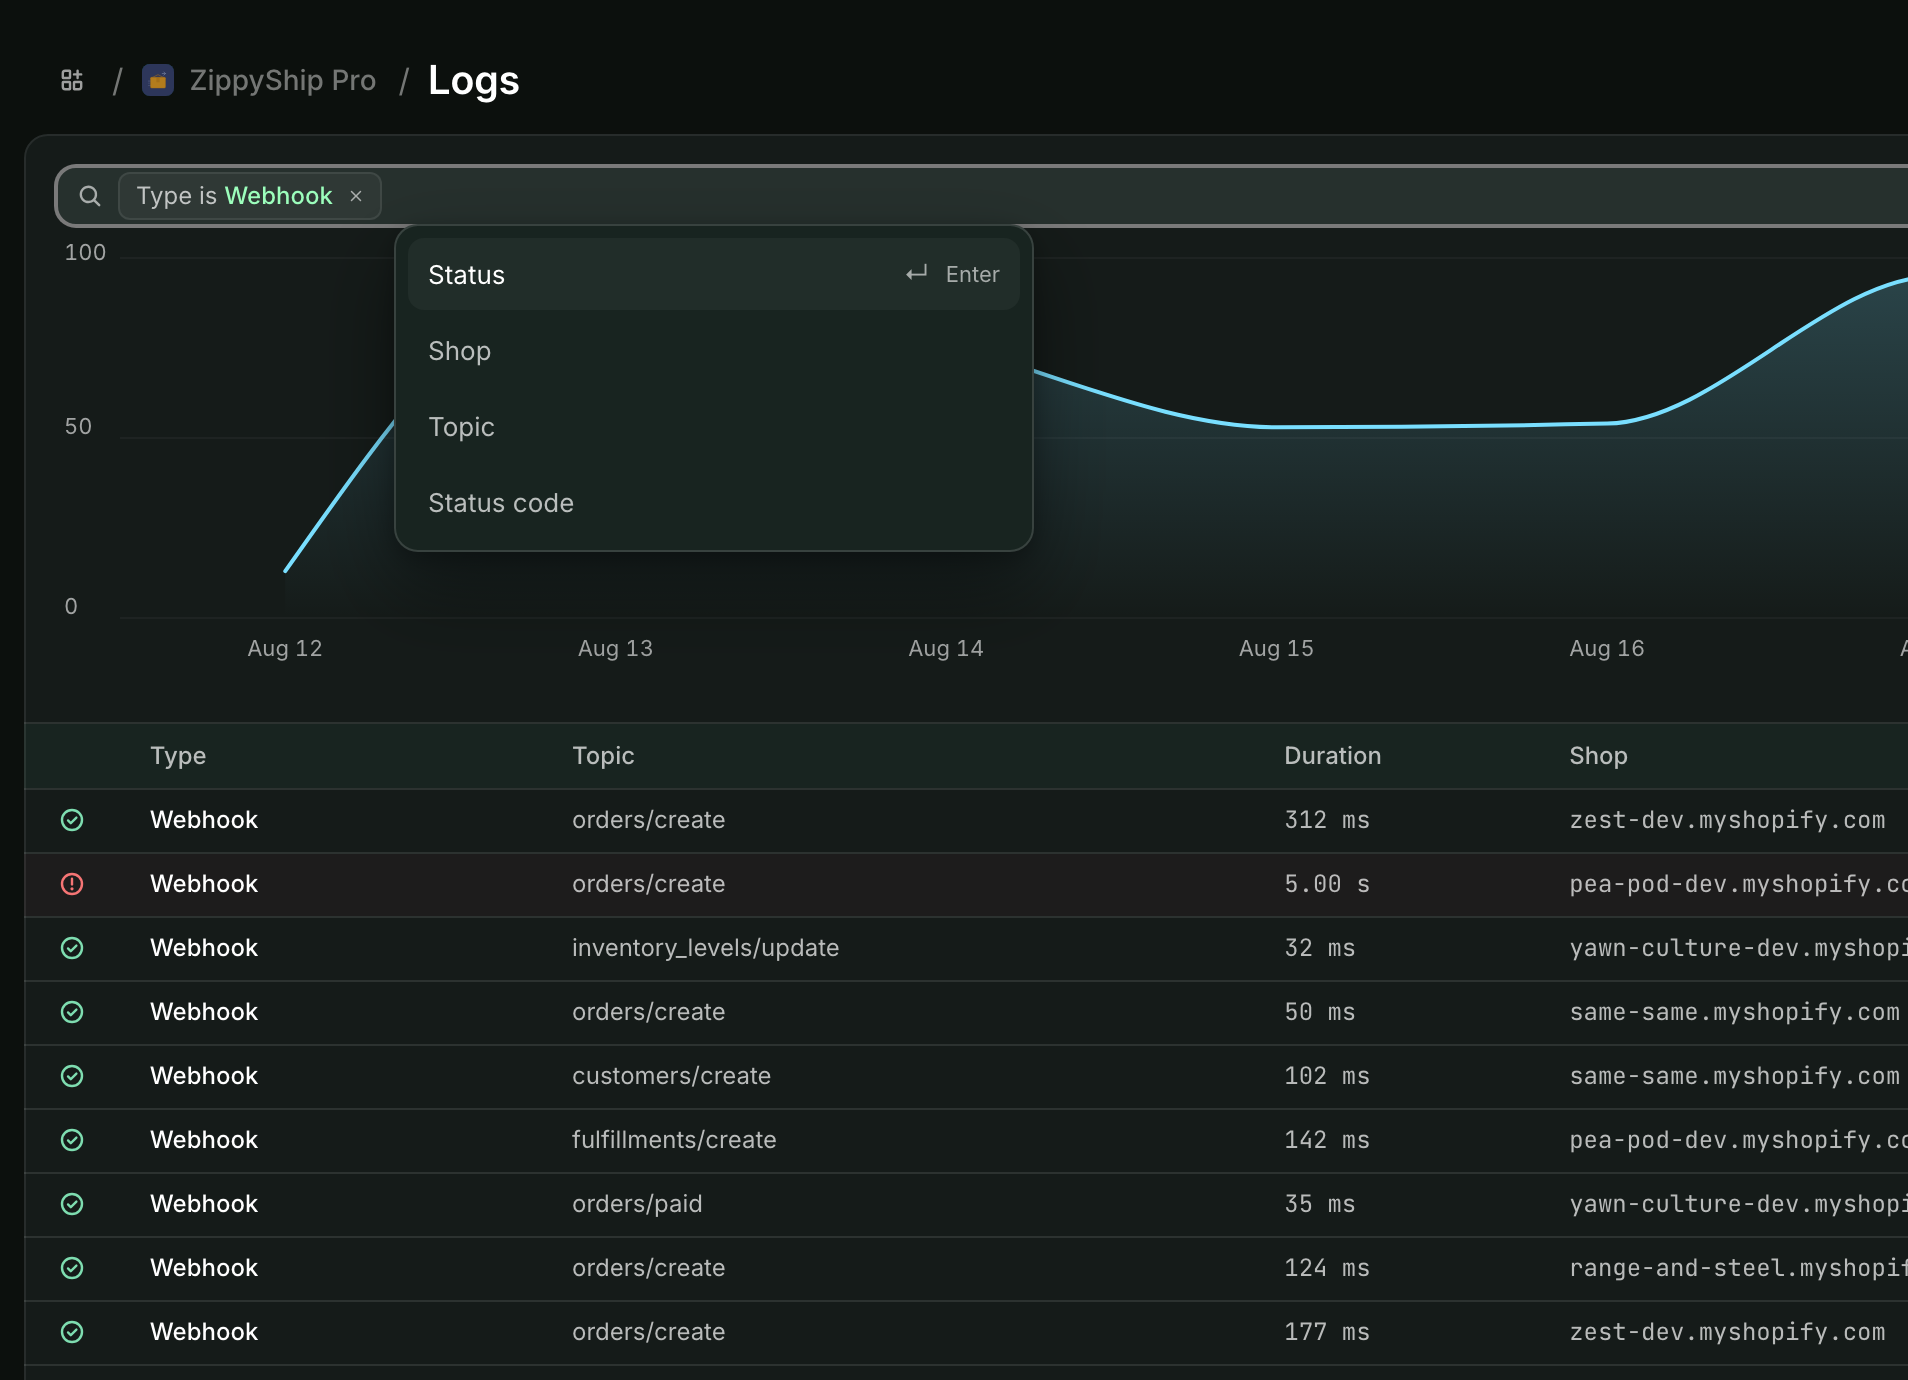
The Logs view has two parts:
- Event graph: Event volume over the selected time period, reflecting whatever filters you've applied. The Overview charts always cover your whole app, but this graph shows only the slice you've filtered to. Spikes can help you identify periods of high volume or potential issues.
- Log entries table: The events matching your filters, in time order. Select a row to open its details.
On a wide time range the table can show a sample rather than every match. It tells you when that happens, so narrow the filters before you conclude an event never happened.
Anchor to Filtering logsFiltering logs
Filtering is how you get from every event your app produced to the specific ones you're investigating. Set the time range using the dropdown, then add filters in the Filter logs field. Each filter is a dimension and a value, and you can combine several.
- Time range: Select one of the preset ranges, or set your own with Custom range. Logs are retained for 30 days, and a single range can span at most 7 days.
- Type: Filter by event type. The Log entry types table lists the types you can choose.
- Shop: Focus on logs for a specific merchant's shop.
- Status and Status code: Filter by delivery outcome, or by HTTP status code to find successful (202) or failed (4xx, 5xx) requests.
- Type-specific dimensions: Selecting a Type unlocks the dimensions for that event type. See Log entry types for the full set.
Anchor to Log entry typesLog entry types
Filtering by Type also determines which other dimensions you can filter on.
| Type | What it records | Additional filters |
|---|---|---|
| Webhook | Webhook deliveries, showing the topic (for example, orders/create). | Status, Status code, Topic |
| Function | Shopify Function runs, showing the target (for example, cart-transform). | Status, Target, Function, Function ID, Error type, Cart/checkout token |
| App event | Events sent through the App Events API, showing the event handle (for example, sms_sent). | Event name, Attribute |
| App billing event | App events that Shopify App Pricing processed as usage-based billing events. | Event name, Status |
| GraphQL request | Requests your app made to the GraphQL Admin API. | Status, Target, Client IP, Operation, User agent |
| REST request | Requests your app made to the REST Admin API. | Status, Target, Client IP, User agent, Response code |
| UI extension error | Errors surfaced by your app's UI extensions. | Status, Target |
| Sidekick event | The result of Shopify's security scan of your app's Sidekick extensions, recorded when the app is installed as a preview. | Status, Target |
Every type can also be filtered by Shop.
Opening an entry shows the context behind it: the API version the call requested, how long it took, and for GraphQL, what the query cost against your remaining rate limit. Webhook entries add the delivery method and which attempt this was, which is usually enough to tell a bad endpoint from a bad payload.
Two things can be missing from an entry. Large request and response bodies are cut off and marked (truncated). A Function run's input, output, and logs aren't always available: they're shown when your app holds the scopes that cover them, or when you can reach the store yourself. Where scopes are the reason, the entry lists the ones it would need. Some runs are hidden without giving a reason, so a blank payload isn't always a scope problem.
If you're using Shopify App Pricing with usage-based pricing and sending billable events through the App Events API, use the Logs view to monitor and troubleshoot errors with your billable events. Filter by App billing event and check it regularly to confirm your usage events are being accepted.
If you're using Shopify App Pricing with usage-based pricing and sending billable events through the App Events API, use the Logs view to monitor and troubleshoot errors with your billable events. Filter by App billing event and check it regularly to confirm your usage events are being accepted.
Anchor to Investigating issuesInvestigating issues
When a merchant reports a problem, filter to their shop and the hour it happened, then read the entries in order.
Logs records what Shopify sees: the Admin API calls your app made, the webhooks and Function runs Shopify sent it, UI extension errors, and the app events you send yourself. A request a merchant's browser makes straight to your own backend never reaches it, so an empty timeline isn't proof that nothing happened.
A spike or a drop in the event graph is worth narrowing to, since the graph follows whatever filters you've set.
Filtering by 4xx and 5xx collects the failures, though status codes only describe the transport. A GraphQL request can come back 200 and still fail on the operation, so open the entry and read the response before ruling it out.
Anchor to Next stepsNext steps
- About App Events to send your own events into Logs.
- Using App Events to build an end-to-end event flow.
- Troubleshoot webhooks when deliveries are failing.
- Monitoring and handling errors in production for Function runs.
- Troubleshooting with events for app events.