Debug performance issues with the Subrequest Profiler
Learn how to inspect network requests happening on the server side using Hydrogen's Subrequest Profiler. This tool helps you diagnose network and cache performance issues happening on the server side.
Anchor to RequirementsRequirements
- You've completed the getting started guide and have a Hydrogen project that you can run in your local development environment.
Anchor to How to use the Subrequest ProfilerHow to use the Subrequest Profiler
- In your Hydrogen project, start the development server by running
shopify hydrogen dev. - Open your app at http://localhost:3000.
- In a different browser tab, open the Subrequest Profiler at http://localhost:3000/subrequest-profiler.
The interface looks similar to the following screenshot:
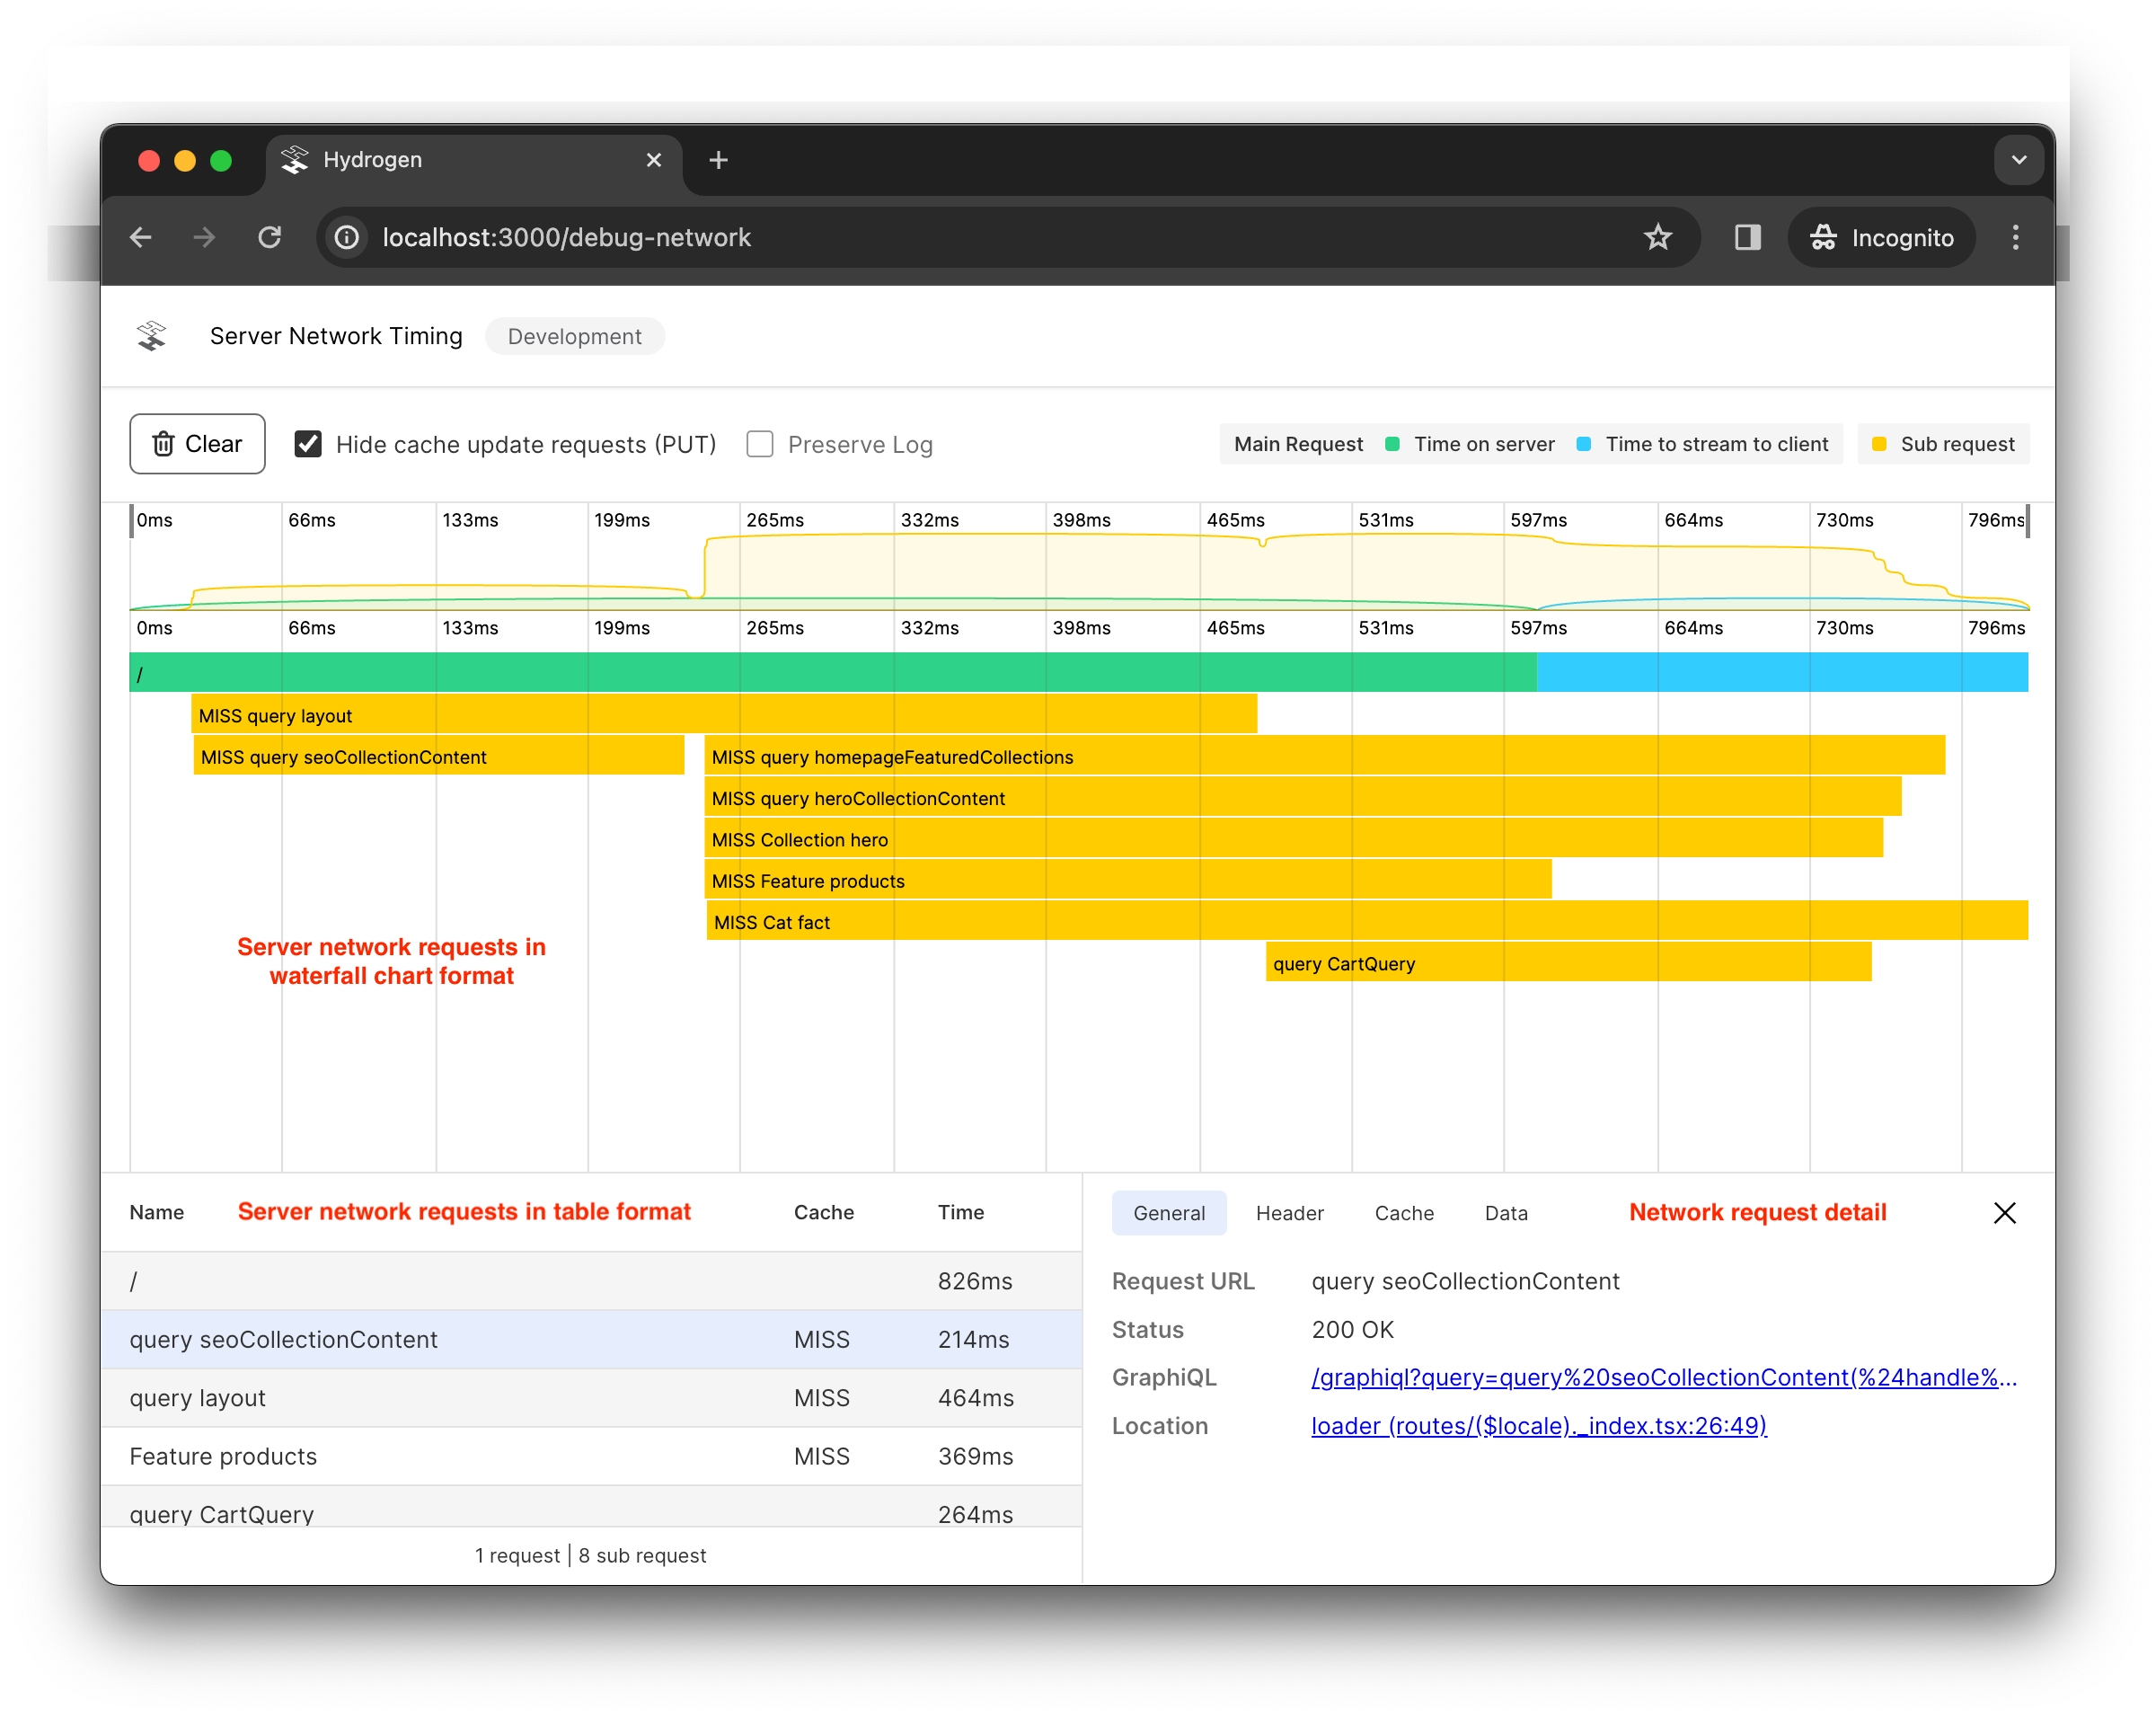
The Subrequest Profiler will capture any server side requests created by createStorefrontClient and createWithCache.fetch or createWithCache.run.
The Subrequest Profiler includes the following components:
- A waterfall chart of server-side network requests. This is a visual representation of when requests are executed, and the time it took to fetch these requests over the network.
- A table of server-side network requests. This is the same network request data as the waterfall cart, presented in tabular format.
- The network request details panel. This provides detailed information for the selected request or subrequest, such as the response headers, cache status, and response data, if available.
To inspect third-party network requests with the Subrequest Profiler, you need to make the request with Hydrogen's createWithCache utility, even if you don't actually store the response data in a cache. Subrequest Profiler does not monitor subrequests made with native fetch.
To inspect third-party network requests with the Subrequest Profiler, you need to make the request with Hydrogen's createWithCache utility, even if you don't actually store the response data in a cache. Subrequest Profiler does not monitor subrequests made with native fetch.
Anchor to How to provide more debug information for a requestHow to provide more debug information for a request
The Subrequest Profiler attempts to select a human-readable name for each request, based on the data query if possible. If you want to customize the request display name, then add the displayName property to your Storefront API queries and mutations:
storefront.query example
/app/routes/($locale)._index.jsx
JavaScript
context.storefront.query(COLLECTION_HERO_QUERY, {
  displayName: 'Collection hero',
  variables: {
    handle: 'backcountry',
    country,
    language,
  },
});
TypeScript
context.storefront.query(COLLECTION_HERO_QUERY, {
  displayName: 'Collection hero',
  variables: {
    handle: 'backcountry',
    country,
    language,
  },
});
For createWithCache.run, you can add additional debug information with the addDebugData function from the action function callback. The following is an example:
createWithCache example
server.js
JavaScript
const withCache = createWithCache({
  cache,
  waitUntil,
  request,
});
const some3PEndpoint = async () => {
  return await withCache.run(
    {
      cacheKey: ['Some cache key'],
      cacheStrategy: CacheLong(),
      shouldCacheResult: () => true,
    },
    ({addDebugData}) => {
      return fetch('https://some-3p-api-endpoint.com').then(async (response) => {
        if (process.env.NODE_ENV === 'development') {
          addDebugData({
            displayName: '3P endpoint name',
            response,
          });
        }
        return (await res.json());
      });
    },
  );
};
TypeScript
const withCache = createWithCache({
  cache,
  waitUntil,
  request,
});
const some3PEndpoint = async () => {
  return await withCache.run<Some3PResponse>(
    {
      cacheKey: ['Some cache key'],
      cacheStrategy: CacheLong(),
      shouldCacheResult: () => true,
    },
    ({addDebugData}) => {
      return fetch('https://some-3p-api-endpoint.com').then(async (response) => {
        if (process.env.NODE_ENV === 'development') {
          addDebugData({
            displayName: '3P endpoint name',
            response
          });
        }
        return (await res.json()) as Some3PResponse;
      });
    },
  );
};
Anchor to How to identify network performance issues with the Subrequest ProfilerHow to identify network performance issues with the Subrequest Profiler
You can diagnose potential network performance issues with the network request waterfall chart. The following are examples of request patterns that often cause performance issues:
Anchor to Request waterfallRequest waterfall
A request waterfall happens when some requests can't begin fetching until a previous request finishes. This slows the overall response time.
The following example is a request waterfall pattern in action:
Request waterfall example
/app/routes/($locale)._index.jsx
JavaScript
export async function loader({context}) {
  return defer({
    query1: await context.some3p('query1'),
    query2: await context.some3p('query2'),
    query3: await context.some3p('query3'),
  });
}
TypeScript
export async function loader({context}: LoaderFunctionArgs) {
return defer({
query1: await context.some3p('query1'),
query2: await context.some3p('query2'),
query3: await context.some3p('query3'),
});
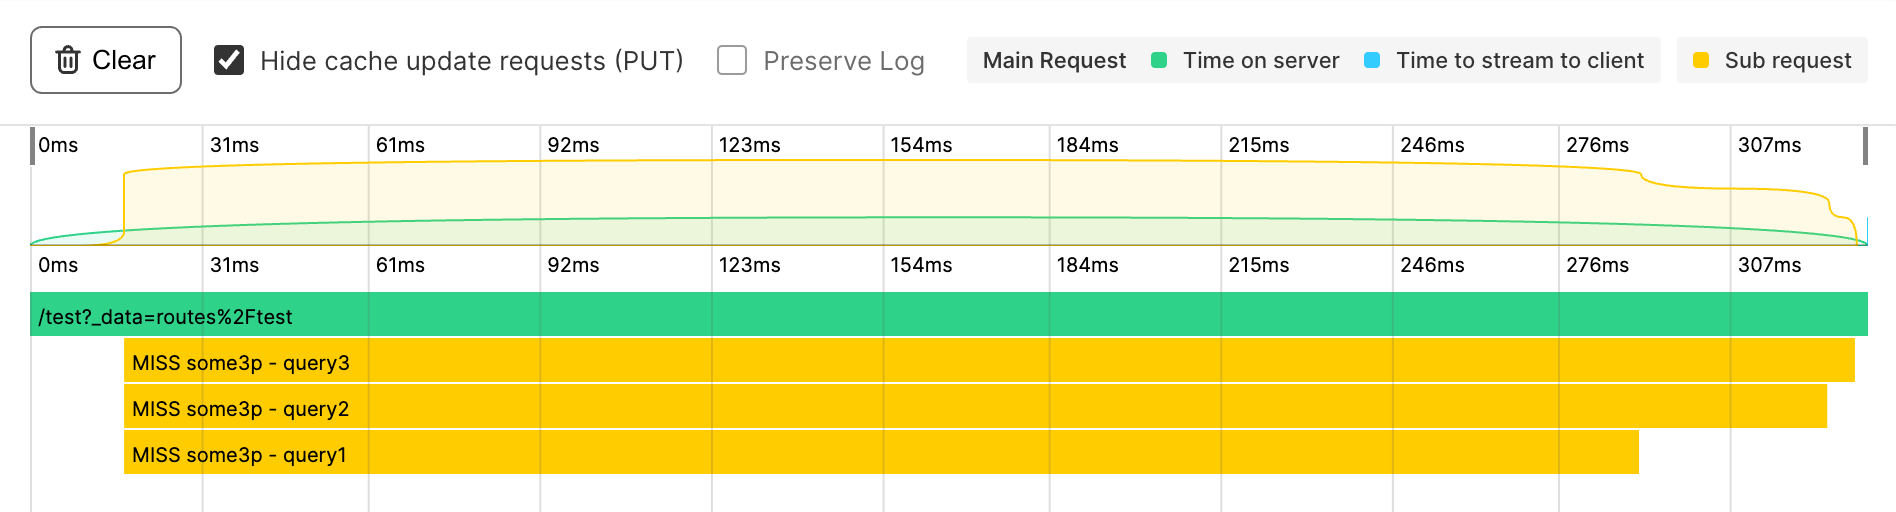
}The following image shows the waterfall query in action. The server can't return any data until all subrequests have completed, with each running one after the other. In this case, it took 900 milliseconds to render the server's response:
Evaluate your queries and determine whether you need the result of a subrequest to start another subrequest. If there's no data required from one query to start another, then it's faster to execute these requests in parallel. The following is an example:
Parallel request example
/app/routes/($locale)._index.jsx
JavaScript
export async function loader({context}) {
  const [query1, query2, query3] = await Promise.all([
    context.some3p('query1'),
    context.some3p('query2'),
    context.some3p('query3'),
  ]);
  return defer({
    query1,
    query2,
    query3,
  });
}
TypeScript
export async function loader({context}: LoaderFunctionArgs) {
const [query1, query2, query3] = await Promise.all([
context.some3p('query1'),
context.some3p('query2'),
context.some3p('query3'),
]);
return defer({
query1,
query2,
query3,
});
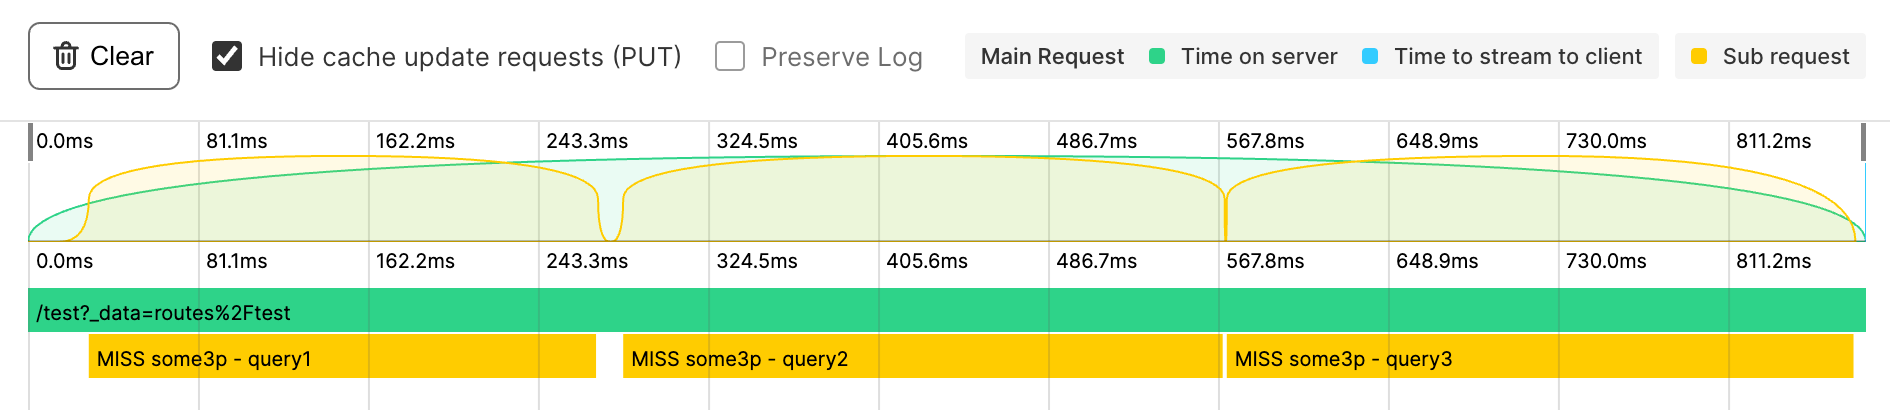
}The following image shows the same requests now running simultaneously, which reduces the server's response time to 300 milliseconds:
Anchor to Defer non-critical requestsDefer non-critical requests
You can reduce the overall time spent server rendering by deferring some subqueries.
For example, your product page might contain critical information like the product description, price, and inventory level, along with less critical data, such as product reviews loaded from a third-party API. In this case, you can return the key product information as soon as it's available, and load the remaining data after the page has loaded.
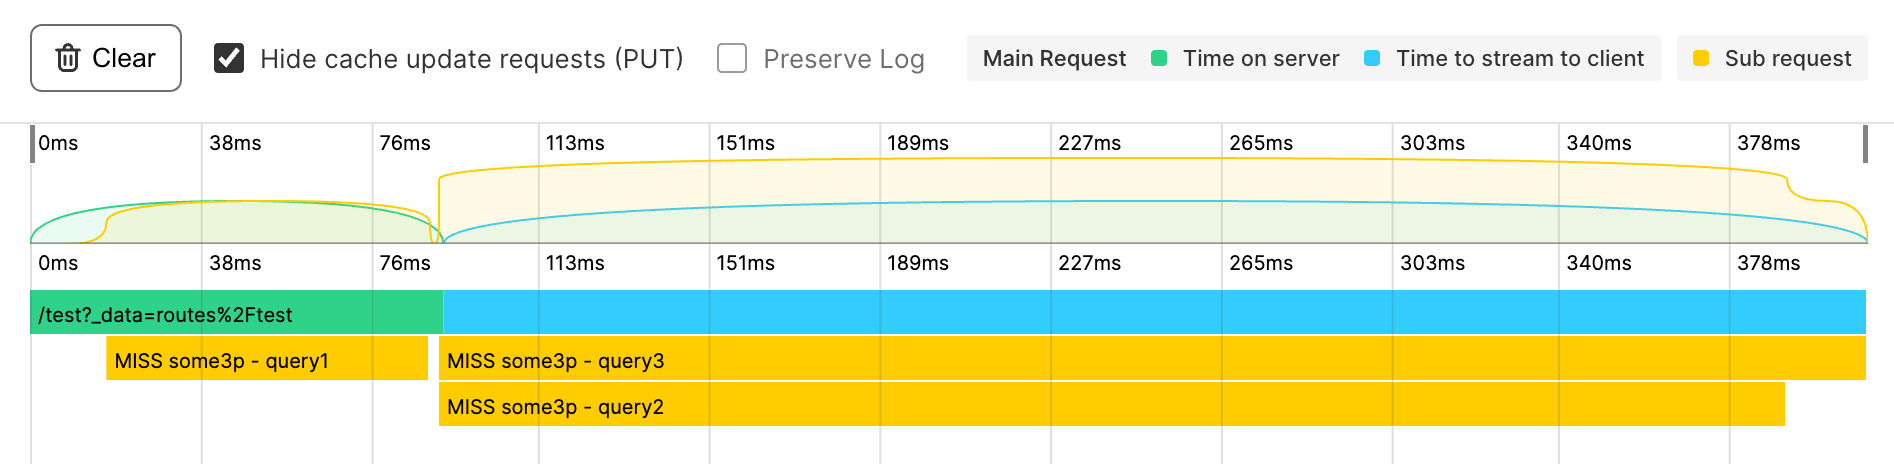
The following example code shows how you can return query1 as soon as possible with the await syntax, while the remaining subqueries run after the page has loaded:
Defer request example
/app/routes/($locale)._index.jsx
JavaScript
export async function loader({context}) {
  return defer({
    query1: await context.some3p('query1'),
    query2: context.some3p('query2'),
    query3: context.some3p('query3'),
  });
}
TypeScript
export async function loader({context}: LoaderFunctionArgs) {
  return defer({
    query1: await context.some3p('query1'),
    query2: context.some3p('query2'),
    query3: context.some3p('query3'),
  });
}
The following image shows the initial page load finishing in 90 milliseconds, while the remaining data starts loading in parallel after the page has rendered in the user's browser: