Attach a debugger to an Oxygen worker
Debuggers are useful for troubleshooting issues in your application code. While it's already possible to debug your frontend code using the browser's developer tools, debugging server code can be challenging in non-Node.js environments. This guide teaches you how to attach a debugger to an Oxygen worker that's running locally.
Anchor to Step 1: Start your development server in debug modeStep 1: Start your development server in debug mode
To get started with server code debugging, you need to start your development server in debug mode. Run the following command in your terminal:
Terminal
The --debug flag enables a port to listen for debugger connections. By default, the port is set to 9229. You can change this port by passing a --inspector-port flag followed by the port number. These flags are also available for the preview command.
The --worker flag is required to start the development server in a mode that mimics an Oxygen worker.
The --worker flag is required to start the development server in a mode that mimics an Oxygen worker.
Anchor to Step 2: Attach a debuggerStep 2: Attach a debugger
You can attach a debugger to your development server using an IDE or browser. Two common options are Visual Studio Code and Chrome DevTools.
Anchor to Visual Studio CodeVisual Studio Code
To attach a debugger from Visual Studio Code, create a new debugger configuration in .vscode/launch.json. Add the following JSON content to connect to your local worker:
.vscode/launch.json
Update the value in the port field if you are using a different port.
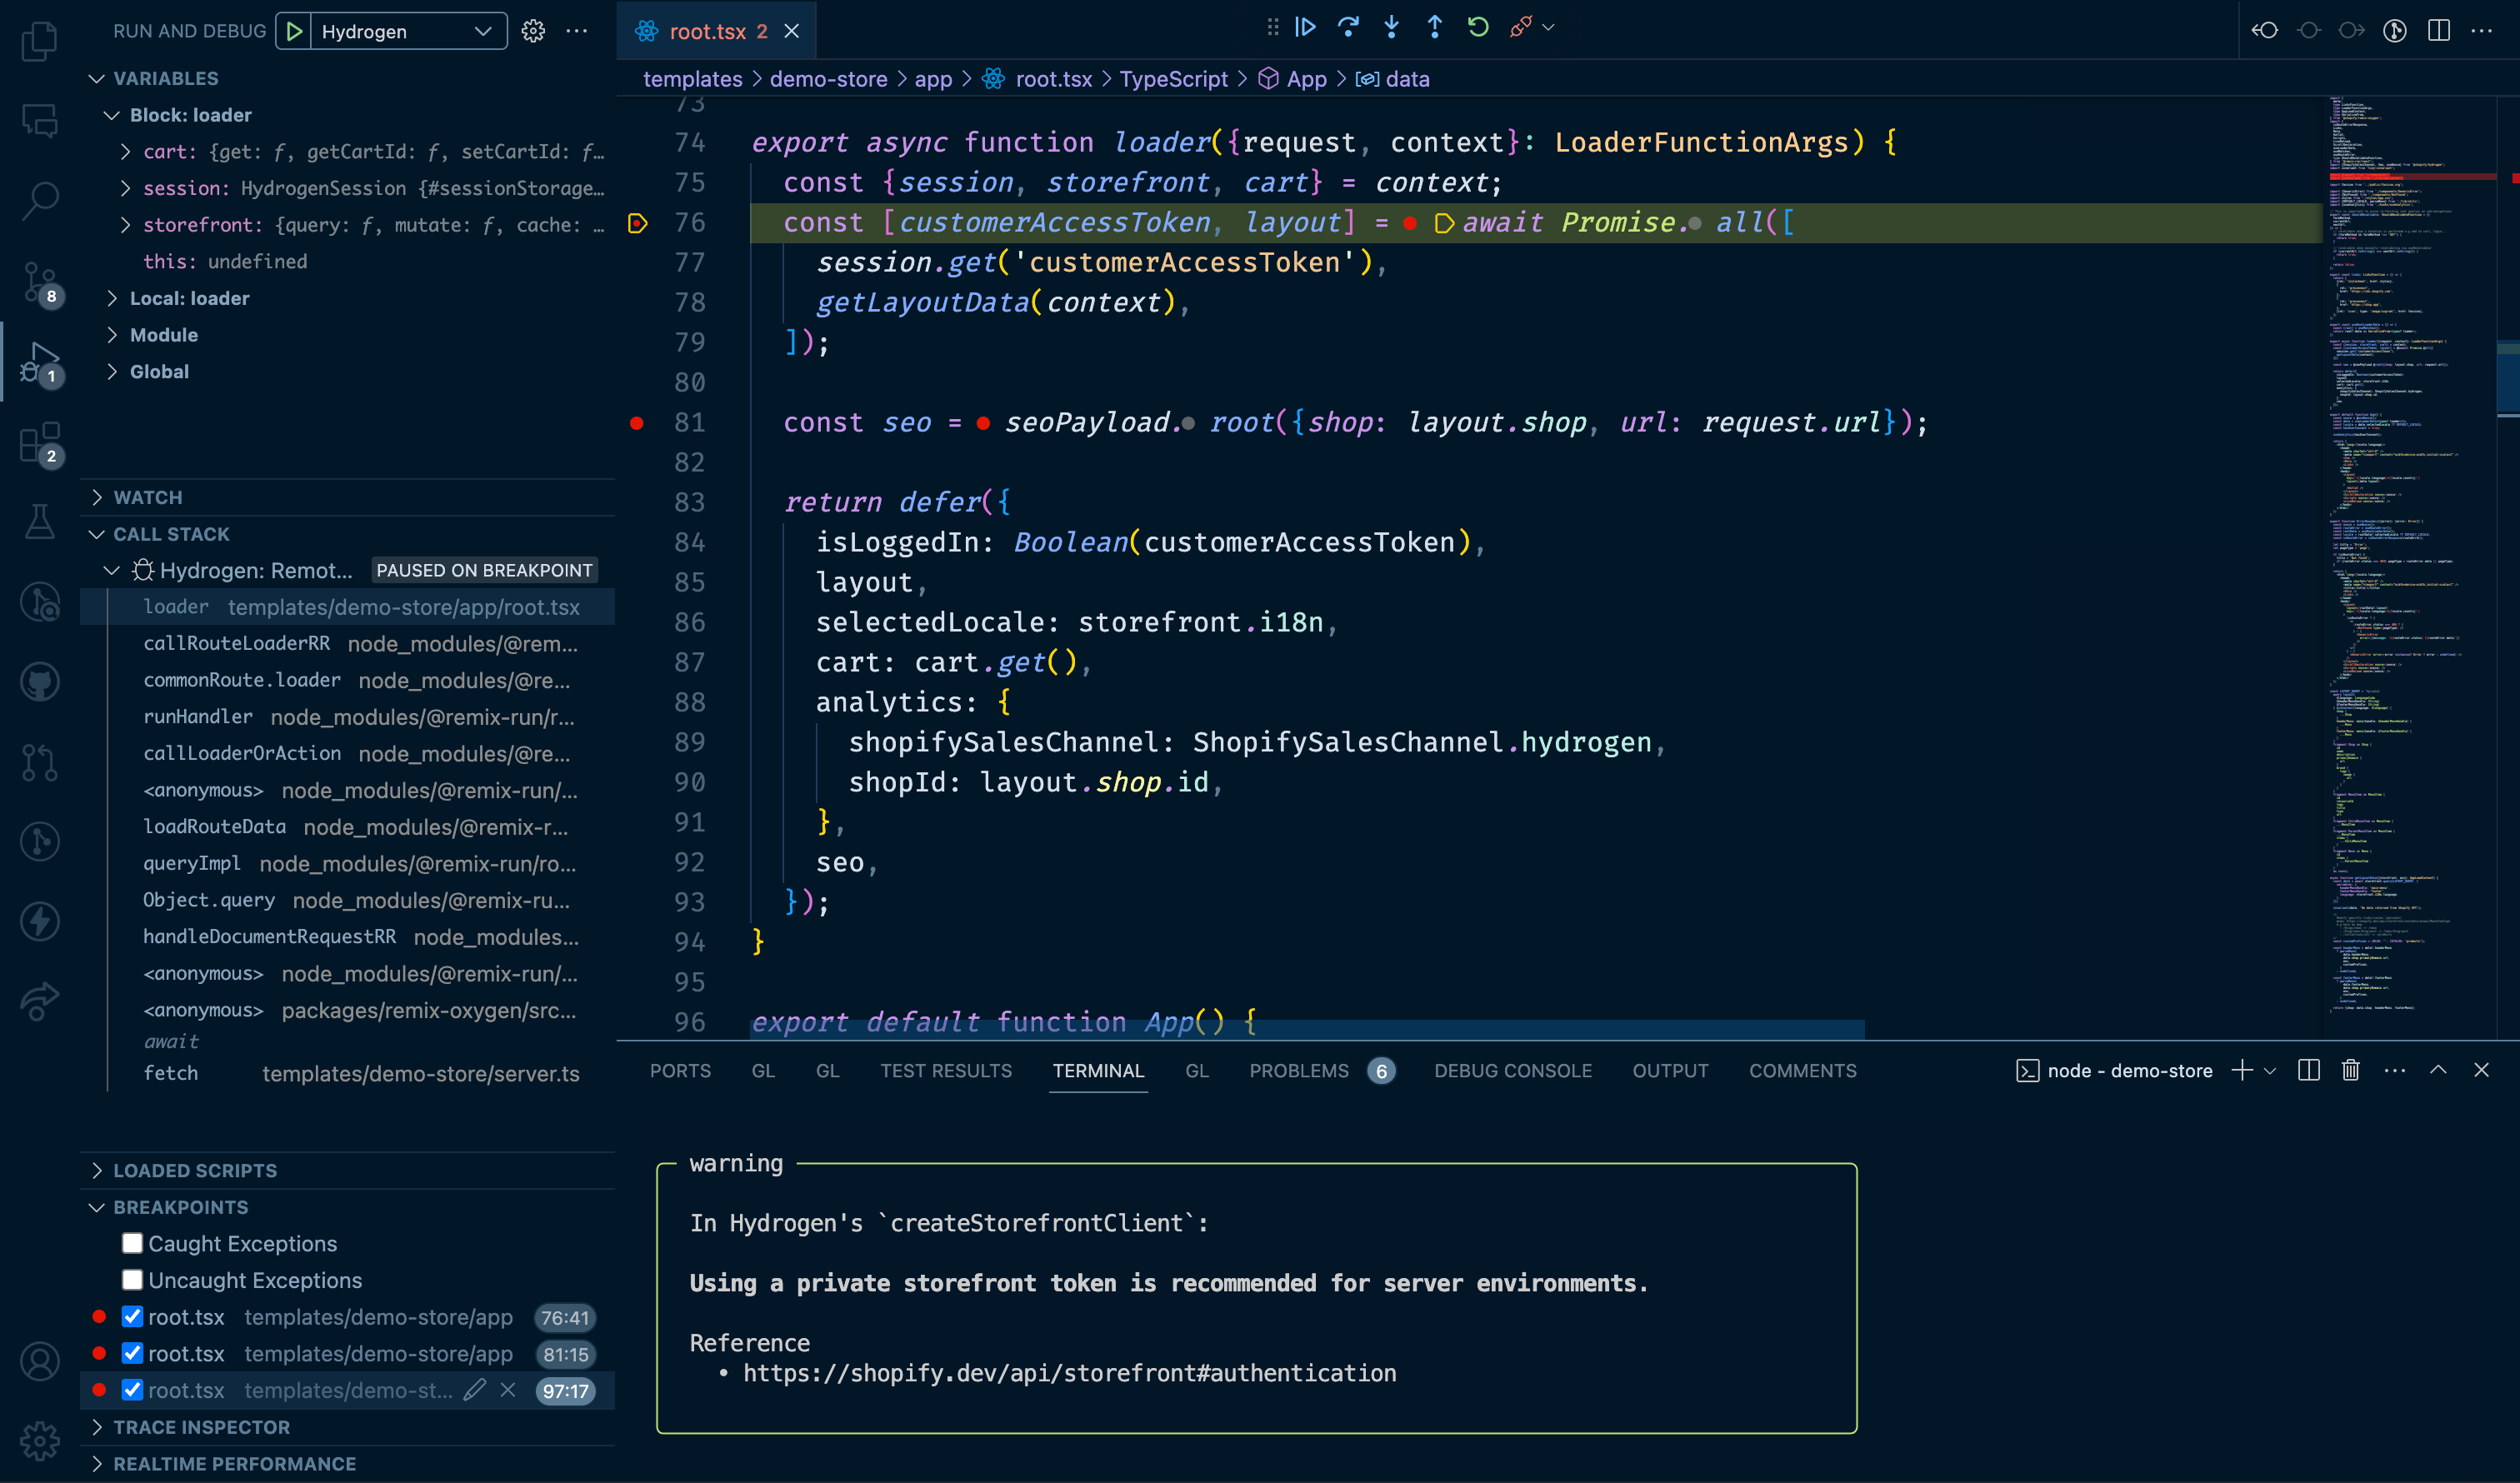
After you've created the configuration file, click Start Debugging in the Visual Studio Code sidebar to connect the debugger to your Oxygen worker.
After the debugger is attached, you can set breakpoints in the editor to stop the execution of your code.
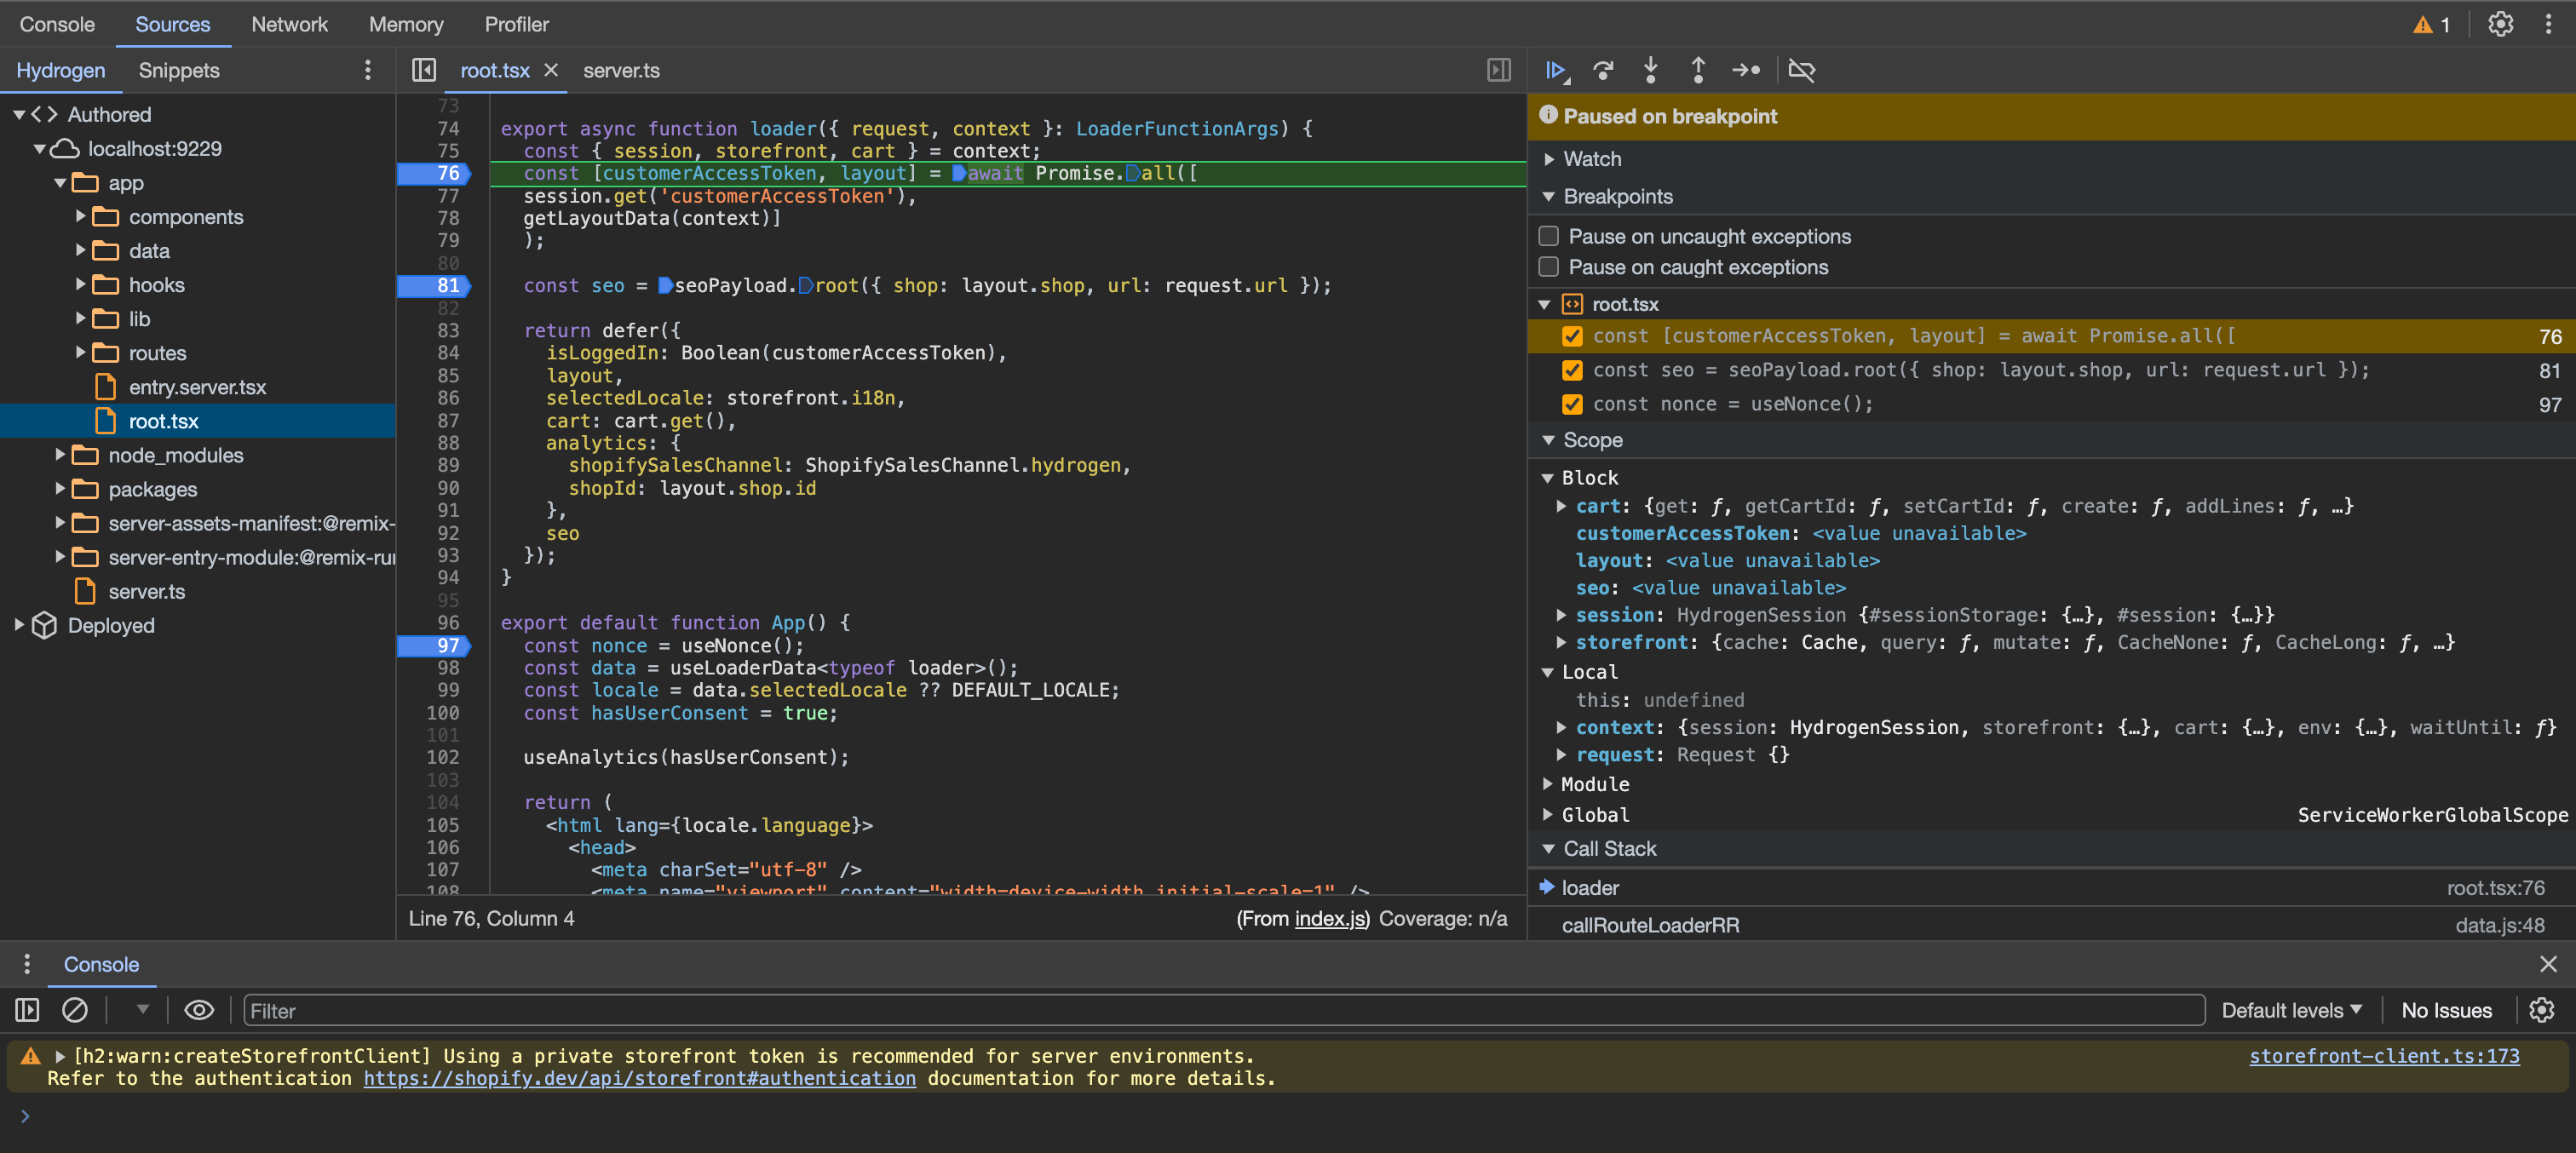
Anchor to Chrome DevToolsChrome Dev
The Hydrogen development server provides an enhanced Chrome DevTools experience for debugging server code through your browser. To use it, open the link shown in the terminal after starting your development server in debug mode. The default link is http://localhost:9229.
You can then set breakpoints in server code to stop the execution of your app in every request, inspect variable values, and step through the code. DevTools also provides a console for you to run arbitrary code in the context of your app.
You can also open this link in other browsers. However, certain features might not be available. Google Chrome or a Chromium-based browser is recommended.
You can also open this link in other browsers. However, certain features might not be available. Google Chrome or a Chromium-based browser is recommended.